Introduction
Optimizing portfolio allocation seems, at first sight, quite a boring and pointless task.
Many people might think that it is impossible to generate substantial returns by adjusting the allocation of value in ETFs that have historically underperformed the S&P500.
That is obviously not true, allocating value in uncorrelated assets reduces overall portfolio volatility and increases risk adjusted returns.
This can be especially interesting when we add leveraged versions of the previous ETFs. Thus, allowing to beat the market in an absolute and risk adjusted basis.
Methods
Idea
For this article, four ETFs will be used: SPY, QQQ, GC=F, TLT.
For the less experienced readers:
SPY tracks the most significant 500 companies of NYSE and NASDAQ.
QQQ tracks the most significant 100 companies of NASDAQ which is composed of mainly tech companies.
GC=F tracks gold price.
TLT tracks 20+ year US treasury bonds.
For this test, only the previous 20 years will be considered, from 2005 to 2025.
Implementation
The data was fetched with yfinance and processed with pandas.
In an initial attempt backtrader was used, however, it was found that this method was too slow, taking over 3 seconds to run a single backtest.
For this reason I decided to implement a custom backtest that was significantly faster taking only 300ms to run. Further optimization would be possible but at this point the extra effort would not give substantial improvements.
All possible weight combinations (representing portfolio allocation) with a step of 5% were tested. And the strategy with the highest sharpe ratio was chosen.
The 3X leverage version of the previous ETFs were calculated by multiplying the daily return by 3 and subctracting a daily fee of 0.01%.
Results
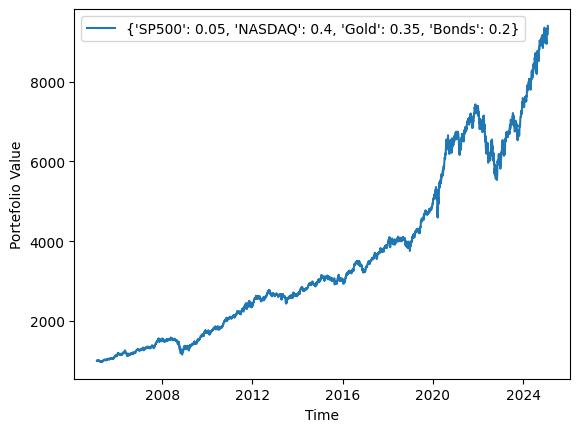
It was found that the strategy with the highest sharpe ratio had the allocation:
- SPY: 5%
- QQQ: 40%
- GC=F: 35%
- TLT: 20%
CAGR: 0.107; Sharpe: 0.860; Max Drawdown: 25.6%.
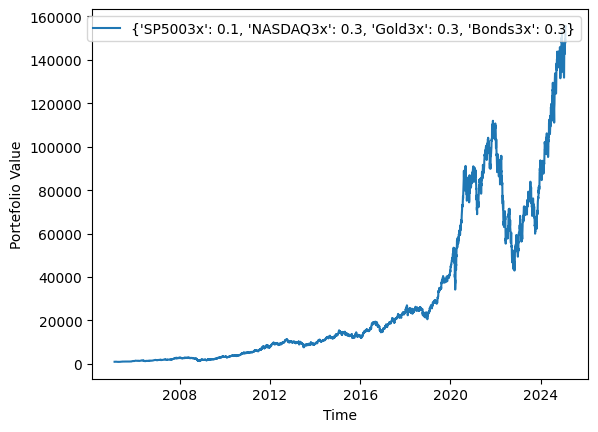
The leveraged versions of the ETFs gave even better results:
- SPY: 10%
- QQQ: 30%
- GC=F: 30%
- TLT: 30%
CAGR: 0.287; Sharpe: 0.878; Max Drawdown: 61.6%.
Conclusion
This is quite a surprising result, after learning obtaining this results I started reallocating my portfolio more into QQQ and Gold.
I have high confidence on the weight values obtained, as they are backtested on a long time period and are unlikely to be overfitted.
Still, I would not advise to follow this exact allocation, an higher percentage allocated in SPY would give a wider market reach.
I expect to continue this work and use a function to dynamically adjust the weights based on current market conditions that will be chosen based on major indices such as the VIX.